Complete Guide to Monitoring iOS Device GPU Usage with Keymob
1. Overview
Keymob provides detailed monitoring capabilities for Apple Silicon GPUs, offering deep insights into Metal rendering pipeline performance metrics. This guide will help you master:
- Accurate interpretation of GPU core metrics
- Techniques to assess Metal API call efficiency
- Identifying and optimizing GPU performance bottlenecks
2. GPU Core Metric Analysis
1. Metric Definitions and Health Thresholds
| Metric Name | Definition | Healthy Range | Abnormal Handling Suggestions |
|---|---|---|---|
| Device Utilization | The percentage of time the GPU is executing computation/render tasks | 60%-85% | >90% requires checking for OverDraw or complex shaders |
| Renderer Utilization | The percentage of time the rasterization unit is active | 40%-70% | <30% suggests a vertex processing bottleneck |
| Tile Utilization | Memory bandwidth usage in Tile-Based architecture | 50%-80% | >90% needs optimization of texture compression format |
| VRAM Bandwidth Usage | Data transfer rate between the GPU and VRAM (Pro versions only) | <80% of peak bandwidth | Sustained full usage requires reducing RenderTarget switching |
2. Device Architecture Features
Based on Apple A/M series chips’ Unified Memory architecture:
- GPU and CPU share the same memory pool, requiring simultaneous attention to memory bandwidth metrics
- Sudden spikes in VRAM bandwidth usage can lead to CPU-side delays
3. Detailed Operational Process
1. Starting the GPU Monitoring Module
- Connect Device: Connect your iOS device to Keymob via USB or Wi-Fi
- Navigation: From the left menu, select Performance Monitoring → Performance Graph
- Activate Metrics: In the top dropdown, select “GPU Monitoring”
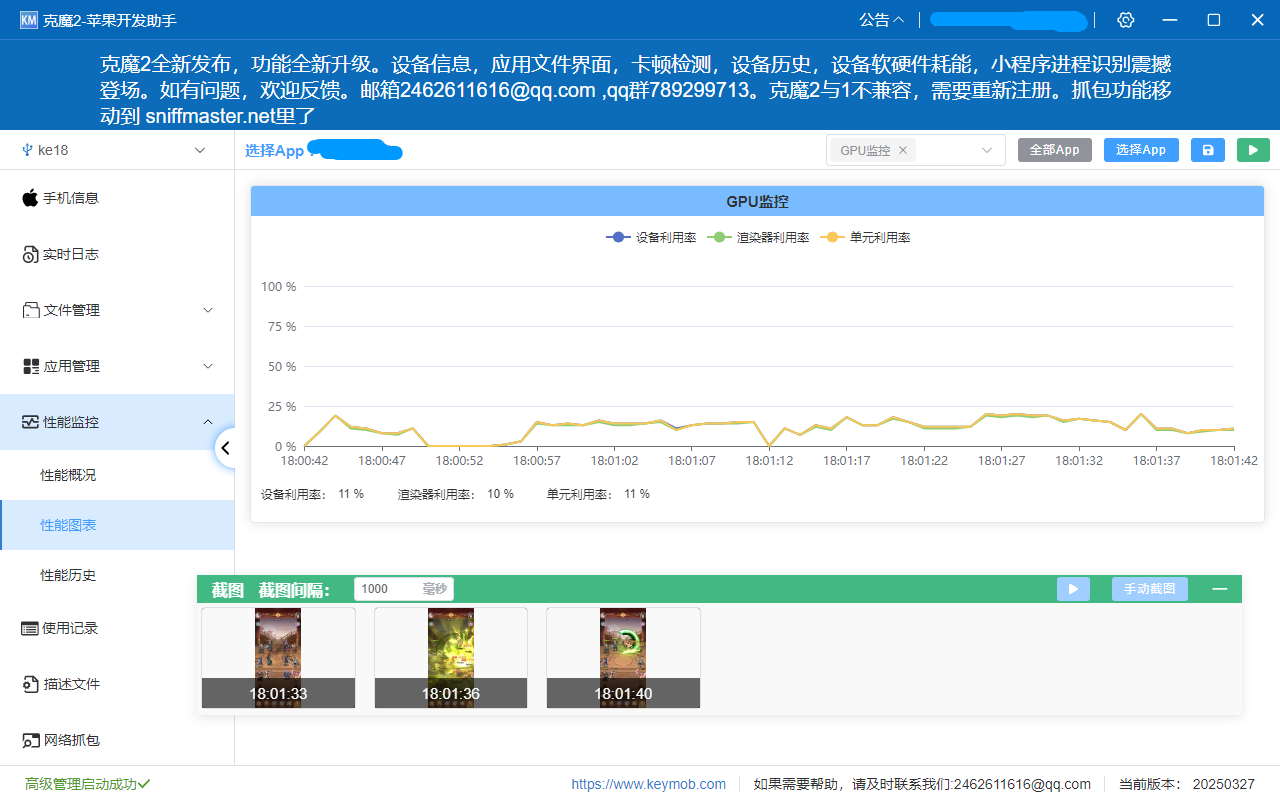
2. Data Collection and Scene Testing
- Click Start: Displays real-time GPU metrics curves
- Test Scenario Design:
- High-load scenarios: Enable particle effects or complex lighting
- Stress tests: Rapidly switch 3D views or zoom in/out of maps
4. Performance Bottleneck Diagnosis
1. Bottleneck Type Decision Matrix
| Device Utilization | Renderer Utilization | Tile Utilization | Bottleneck Type | Optimization Direction |
|---|---|---|---|---|
| High (>90%) | High (>80%) | Low (<50%) | Compute-intensive bottleneck | Simplify Compute Kernel logic |
| Medium (60%-80%) | Low (<40%) | Medium (50%-70%) | Vertex processing bottleneck | Optimize Mesh LOD/Reduce vertex count |
| Low (<50%) | High (>70%) | High (>85%) | Bandwidth bottleneck | Enable ASTC texture compression |
| Fluctuating | Synchronized fluctuations | Stable | CPU-GPU synchronization issue | Reduce Metal API call frequency |
2. Typical Case Analysis
Case 1: Open-World Game Lag
- Symptoms: Device utilization over 95%, frame rate fluctuating
- Diagnosis: Excessive dynamic branching in terrain shaders
- Optimization: Pre-calculate terrain LOD to textures, reducing runtime calculations
Case 2: AR Application Overheating
- Symptoms: Tile utilization sustained over 90%, VRAM bandwidth maxed out
- Diagnosis: Mipmap not enabled, resulting in frequent sampling of high-resolution textures
- Optimization: Generate Mipmap chains and add anisotropic filtering